OVERVIEW
The renko charting method is thought to have acquired its name from renga, which is the Japanese word for “bricks.” Renko charts are similar to three-line-break charts except that in a renko chart, a line (or brick, as they are called) is drawn in the direction of the prior move only if prices move by a minimum amount (i.e., the box size). The bricks are always equal in size. For example, in a fiveunit renko chart, a 20-point rally is displayed as four five-unit-tall renko bricks.
The renko charting method is thought to have acquired its name from renga, which is the Japanese word for “bricks.” Renko charts are similar to three-line-break charts except that in a renko chart, a line (or brick, as they are called) is drawn in the direction of the prior move only if prices move by a minimum amount (i.e., the box size). The bricks are always equal in size. For example, in a fiveunit renko chart, a 20-point rally is displayed as four five-unit-tall renko bricks.
ANATOMY
Basic trend reversals are signaled with the emergence of a new white or black brick. A new white brick indicates the beginning of a new uptrend. A new black brick indicates the beginning of a new downtrend (Figure 1).
Basic trend reversals are signaled with the emergence of a new white or black brick. A new white brick indicates the beginning of a new uptrend. A new black brick indicates the beginning of a new downtrend (Figure 1).
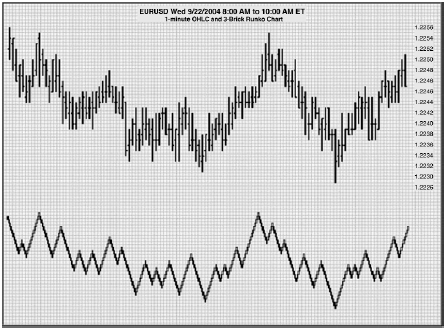
Since the renko chart is a trend-following technique, there are times when renko charts produce whipsaws, giving signals near the end of short-lived trends. However, the expectation with a trendfollowing technique is that it allows the trader to ride the major portion of significant trends. Since a renko chart isolates the underlying price trend by filtering out the minor price changes, renko charts also can be very helpful when determining support and resistance levels (Figure 2).
 |
| Figure 1 Renko Peak and Valley Chart. |
 |
| Figure 2 OHLC With Three-Brick Renko Chart. |
BRICK SIZE
Brick size is analogous to box size in a point and figure chart and determines the minimum price change to display. Renko charts do not have an equivalent to point and figure reversal amount because the default is always one brick. To filter out white noise, simply increase the brick size.
Brick size is analogous to box size in a point and figure chart and determines the minimum price change to display. Renko charts do not have an equivalent to point and figure reversal amount because the default is always one brick. To filter out white noise, simply increase the brick size.
ALGORITHM
To draw renko bricks, today’s close is compared with the high and low of the previous brick (white or black):
- If the closing price rises above the top of the previous brick by at least the box size, one or more white bricks are drawn in new columns. The height of the bricks is always equal to the box size.
- If the closing price falls below the bottom of the previous brick by at least the box size, one or more black bricks are drawn in new columns. Again, the height of the bricks is always equal to the box size.
- If prices move more than the box size but not enough to create two bricks, only one brick is drawn. For example, in a two-unit renko chart, if the prices move from 100 to 103, only one white brick is drawn from 100 to 102. The rest of the move, from 102 to 103, is not shown on the chart.
Note that the x axis does not represent time in a perfectly linear fashion because there is always one x-axis unit per brick. If the background grid is set at 1X1, then vertices also will be at right angles.
REFERENCES
Nison, Steven, Beyond Candlesticks: More Japanese Charting Techniques Revealed (New York: Wiley, 1994).
Nison, Steven, Japanese Candlestick Charting Techniques (New York: Hall, 1991).
www. linnsoft.com/welcome/charts.htm.