OVERVIEW
Probably the most successful and most used means of making decisions and analyzing Forex markets is technical analysis. The difference between technical analysis and fundamental analysis is that technical analysis is applied only to the price action of the market. While fundamental data often can provide only a long-term forecast of exchange-rate movements, technical analysis has become the primary tool to analyze and trade short-term price movements successfully, as well as to set profit targets and stop-loss safeguards, because of its ability to generate price-specific information and forecasts. Technical analysts are by nature chart mongers. The more charts there are, the better is the forecast.
Probably the most successful and most used means of making decisions and analyzing Forex markets is technical analysis. The difference between technical analysis and fundamental analysis is that technical analysis is applied only to the price action of the market. While fundamental data often can provide only a long-term forecast of exchange-rate movements, technical analysis has become the primary tool to analyze and trade short-term price movements successfully, as well as to set profit targets and stop-loss safeguards, because of its ability to generate price-specific information and forecasts. Technical analysts are by nature chart mongers. The more charts there are, the better is the forecast.
Historically, technical analysis in the futures markets has focused on the six price fields available during any given period of time: open, high, low, close, volume, and open interest. Since the Forex market has no central exchange, it is very difficult to estimate the latter two fields, volume and open interest. In this section, therefore, we will limit our analysis to the first four price fields.
In this section, the technical analysis methods have been categorized not only be the underlying techniques used but also by the type of output that each category generates. We will begin this summary with pattern recognition, probably the most popular and easiest to use technique within the technical analysis family. This method involves scanning a raw open-high-low-close (OHLC) chart (such as a vertical bar chart or a candlestick chart) from left to right searching for identifiable price formations.
Technical analysis consists primarily of a variety of technical studies, each of which can be interpreted to predict market direction or to generate buy and sell signals. Many technical studies share one common important tool: a price-time chart that emphasizes selected characteristics in the price motion of the underlying security. One great advantage of technical analysis is its “visualness.”
IDENTIFYING PRICE FORMATIONS
Proper identification of an ongoing trend can be a tremendous asset to a trader. However, the trader also must learn to recognize recurring chart patterns that disrupt the continuity of trend lines. Broadly speaking, these chart patterns can be categorized as reversal patterns and continuation patterns.
Proper identification of an ongoing trend can be a tremendous asset to a trader. However, the trader also must learn to recognize recurring chart patterns that disrupt the continuity of trend lines. Broadly speaking, these chart patterns can be categorized as reversal patterns and continuation patterns.
REVERSAL PATTERNS
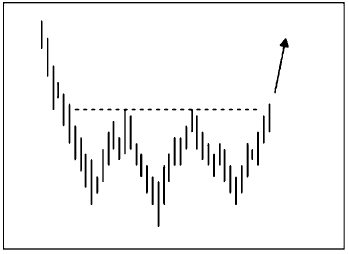
Reversal patterns are important because they inform the trader that a market entry point is unfolding or that it may be time to liquidate an open position. Figures 3-1 through 3-4 display the most common reversal patterns.
CONTINUATION PATTERNS
A continuation pattern implies that while a visible trend was in progress, it was interrupted temporarily and then continued in the direction of the original trend. The most common continuation
patterns are shown in Figures 3-5 through 3-9.
The proper identification of a continuation pattern may prevent a trader from entering a new trade in the wrong direction or from exiting a winning position too early.
 |
| Figure 1 Double Top. |
 |
| Figure 2 Double Bottom. |
 |
| Figure 4 Head and Shoulders Bottom. |
 |
| Figure 5 Flag or Pennant. |
 |
| Figure 6 Symmetrical Triangle. |
 |
| Figure 7 Ascending Triangle. |
 |
| Figure 8 Descending Triangle. |
 |
| Figure 9 Rectangle. |